> For the complete documentation index, see [llms.txt](https://docs.silessian.com/llms.txt). Markdown versions of documentation pages are available by appending `.md` to page URLs; this page is available as [Markdown](https://docs.silessian.com/planapply-for-jira-cloud/admin-features/execution-logs.md).
# Execution logs
Execution logs page contains are executions performed in Terraform console and Remote repositories over given workspace. You need to first select desired workspace in Workspaces page.
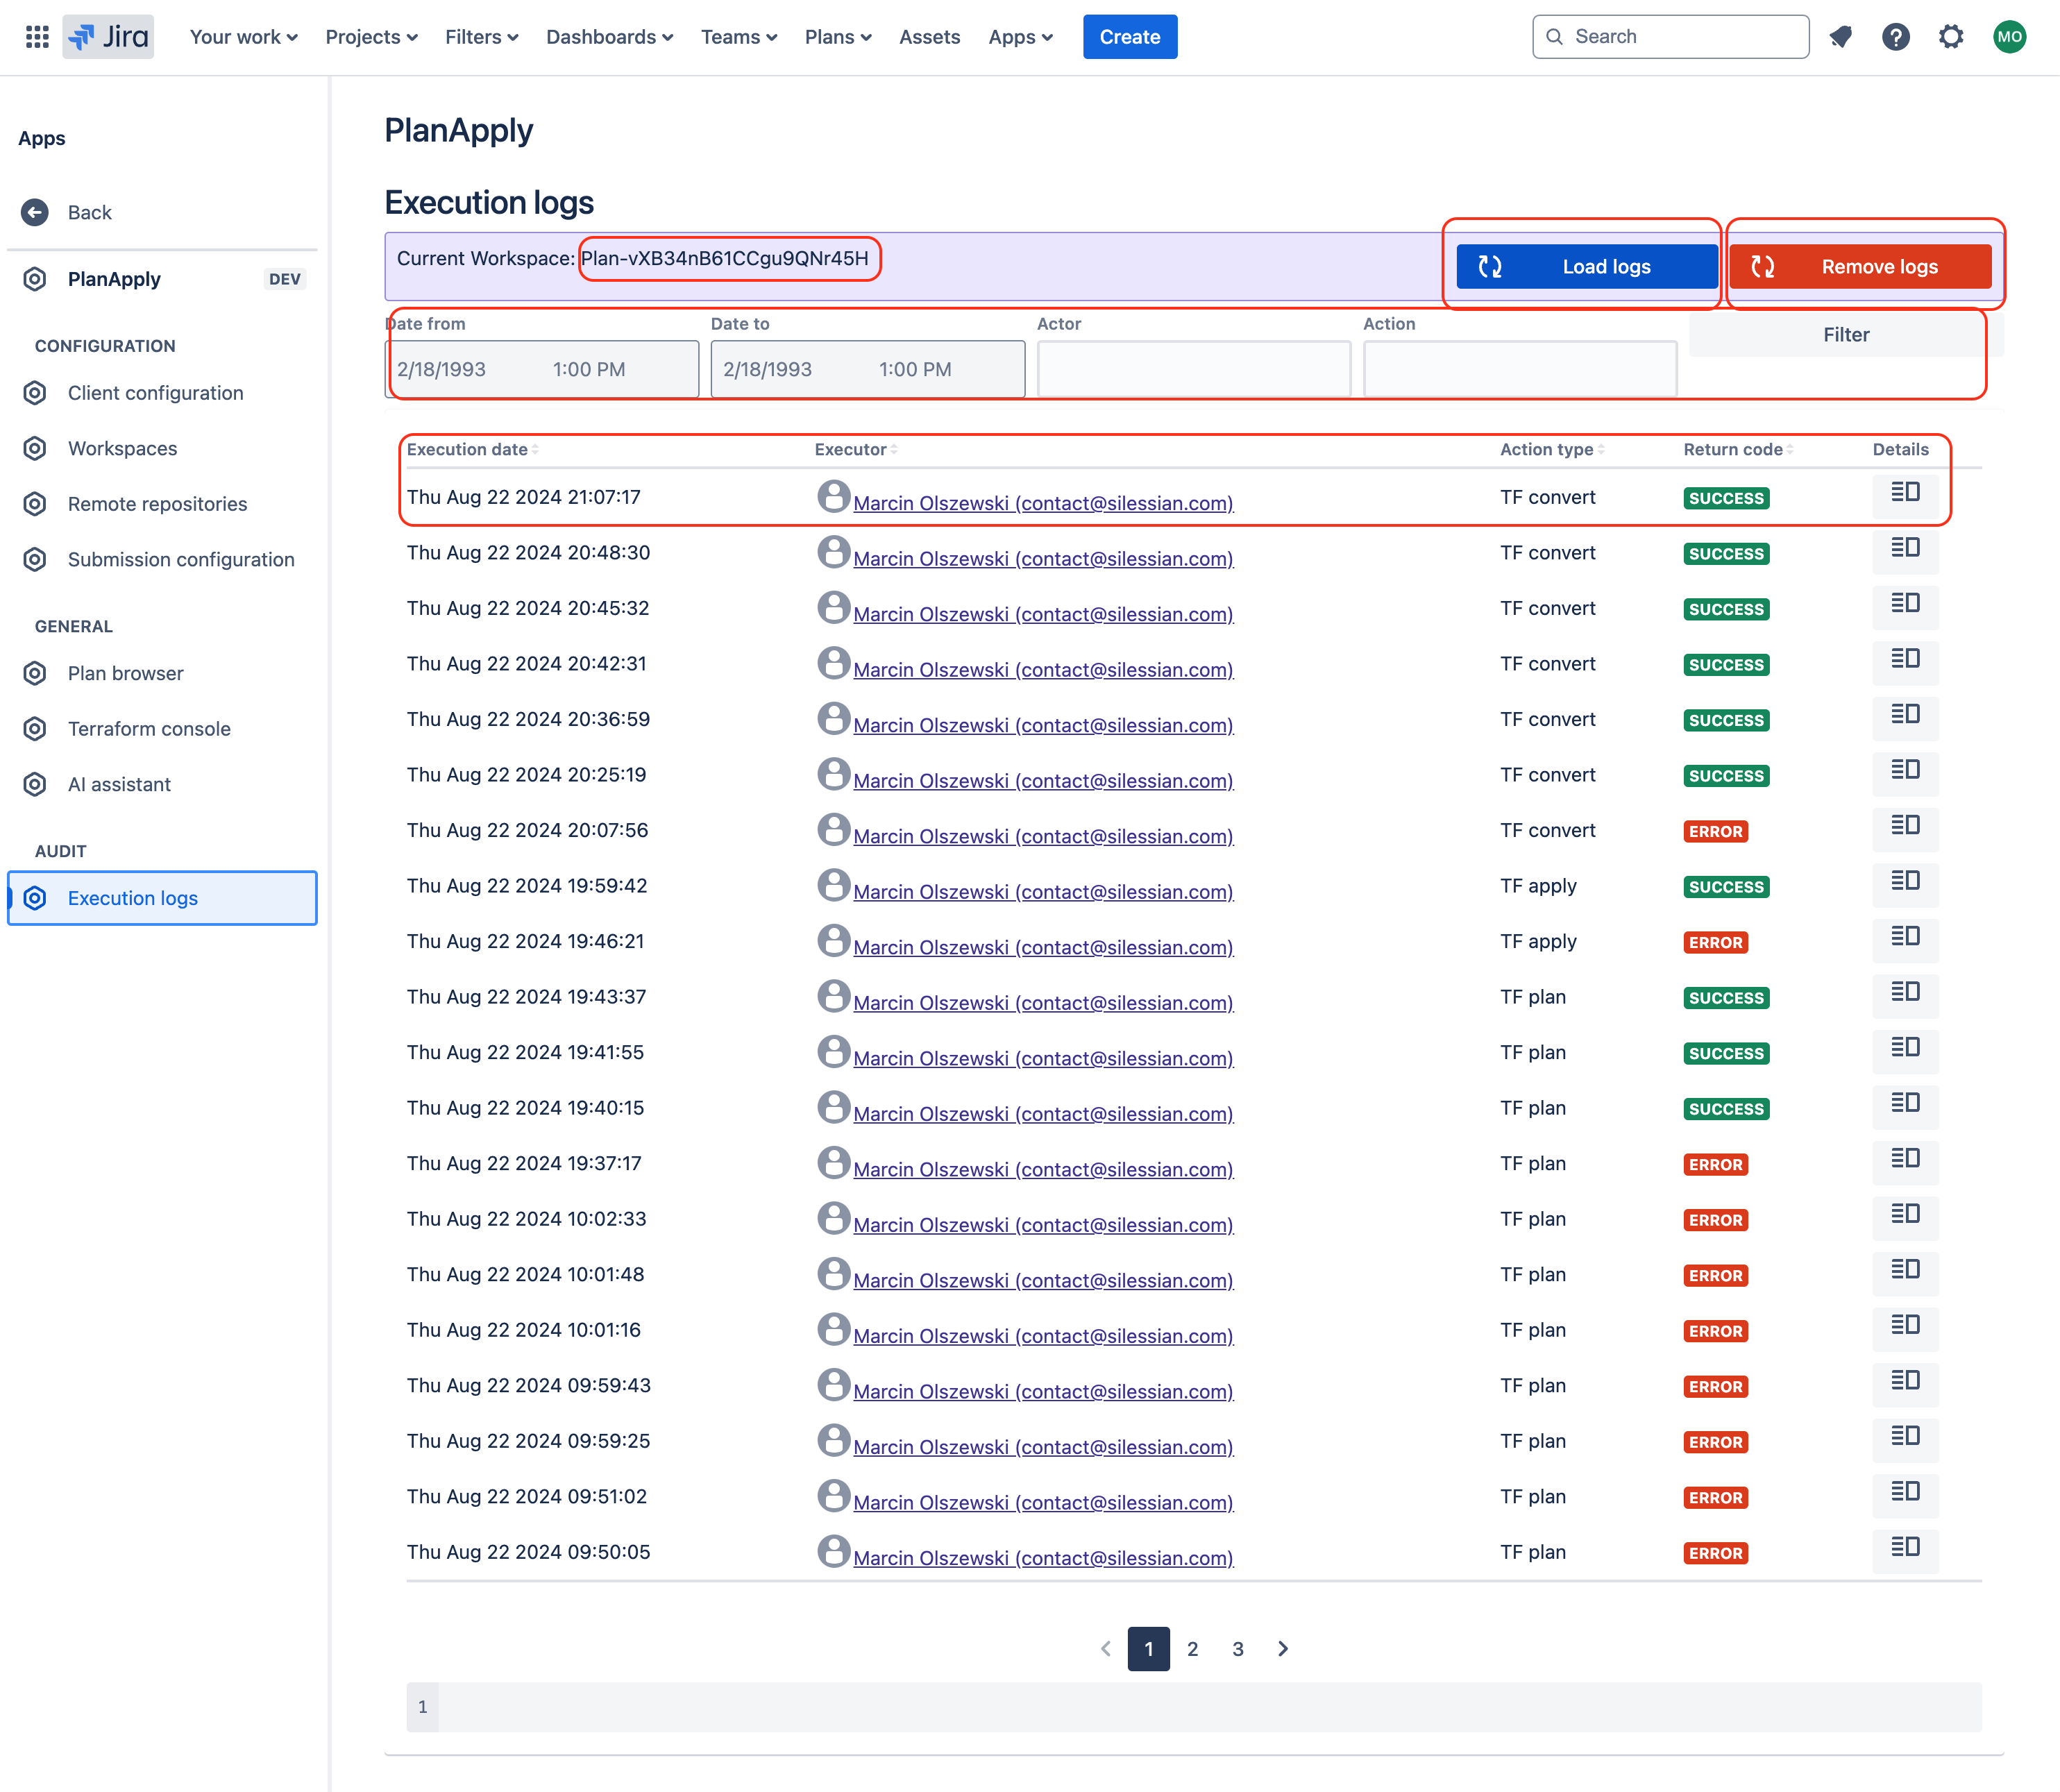
In the UI you can find:
1. Current workspace name
2. Load logs - it will load all logs for given selected workspace
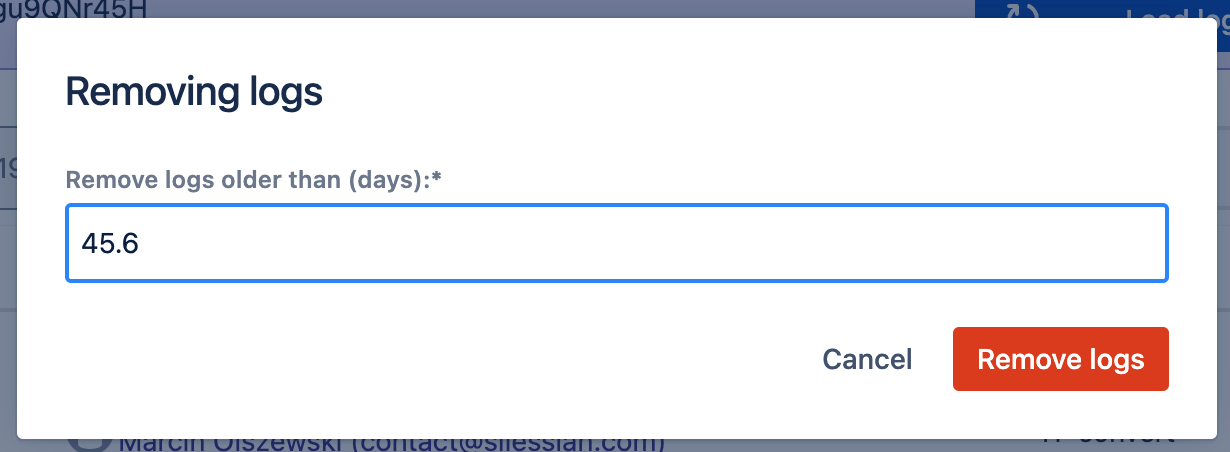
3. Remove logs - You can remove logs that are older than provided number. Number is displayed in days. Float numbers are allowed to handle hours if neede.
Provide days number (float) to remove logs that are older.
4. Filter options - use to filter out displayed execution logs.
5. Table with execution logs. Click on details to checkout Execution logs associated with given operation.
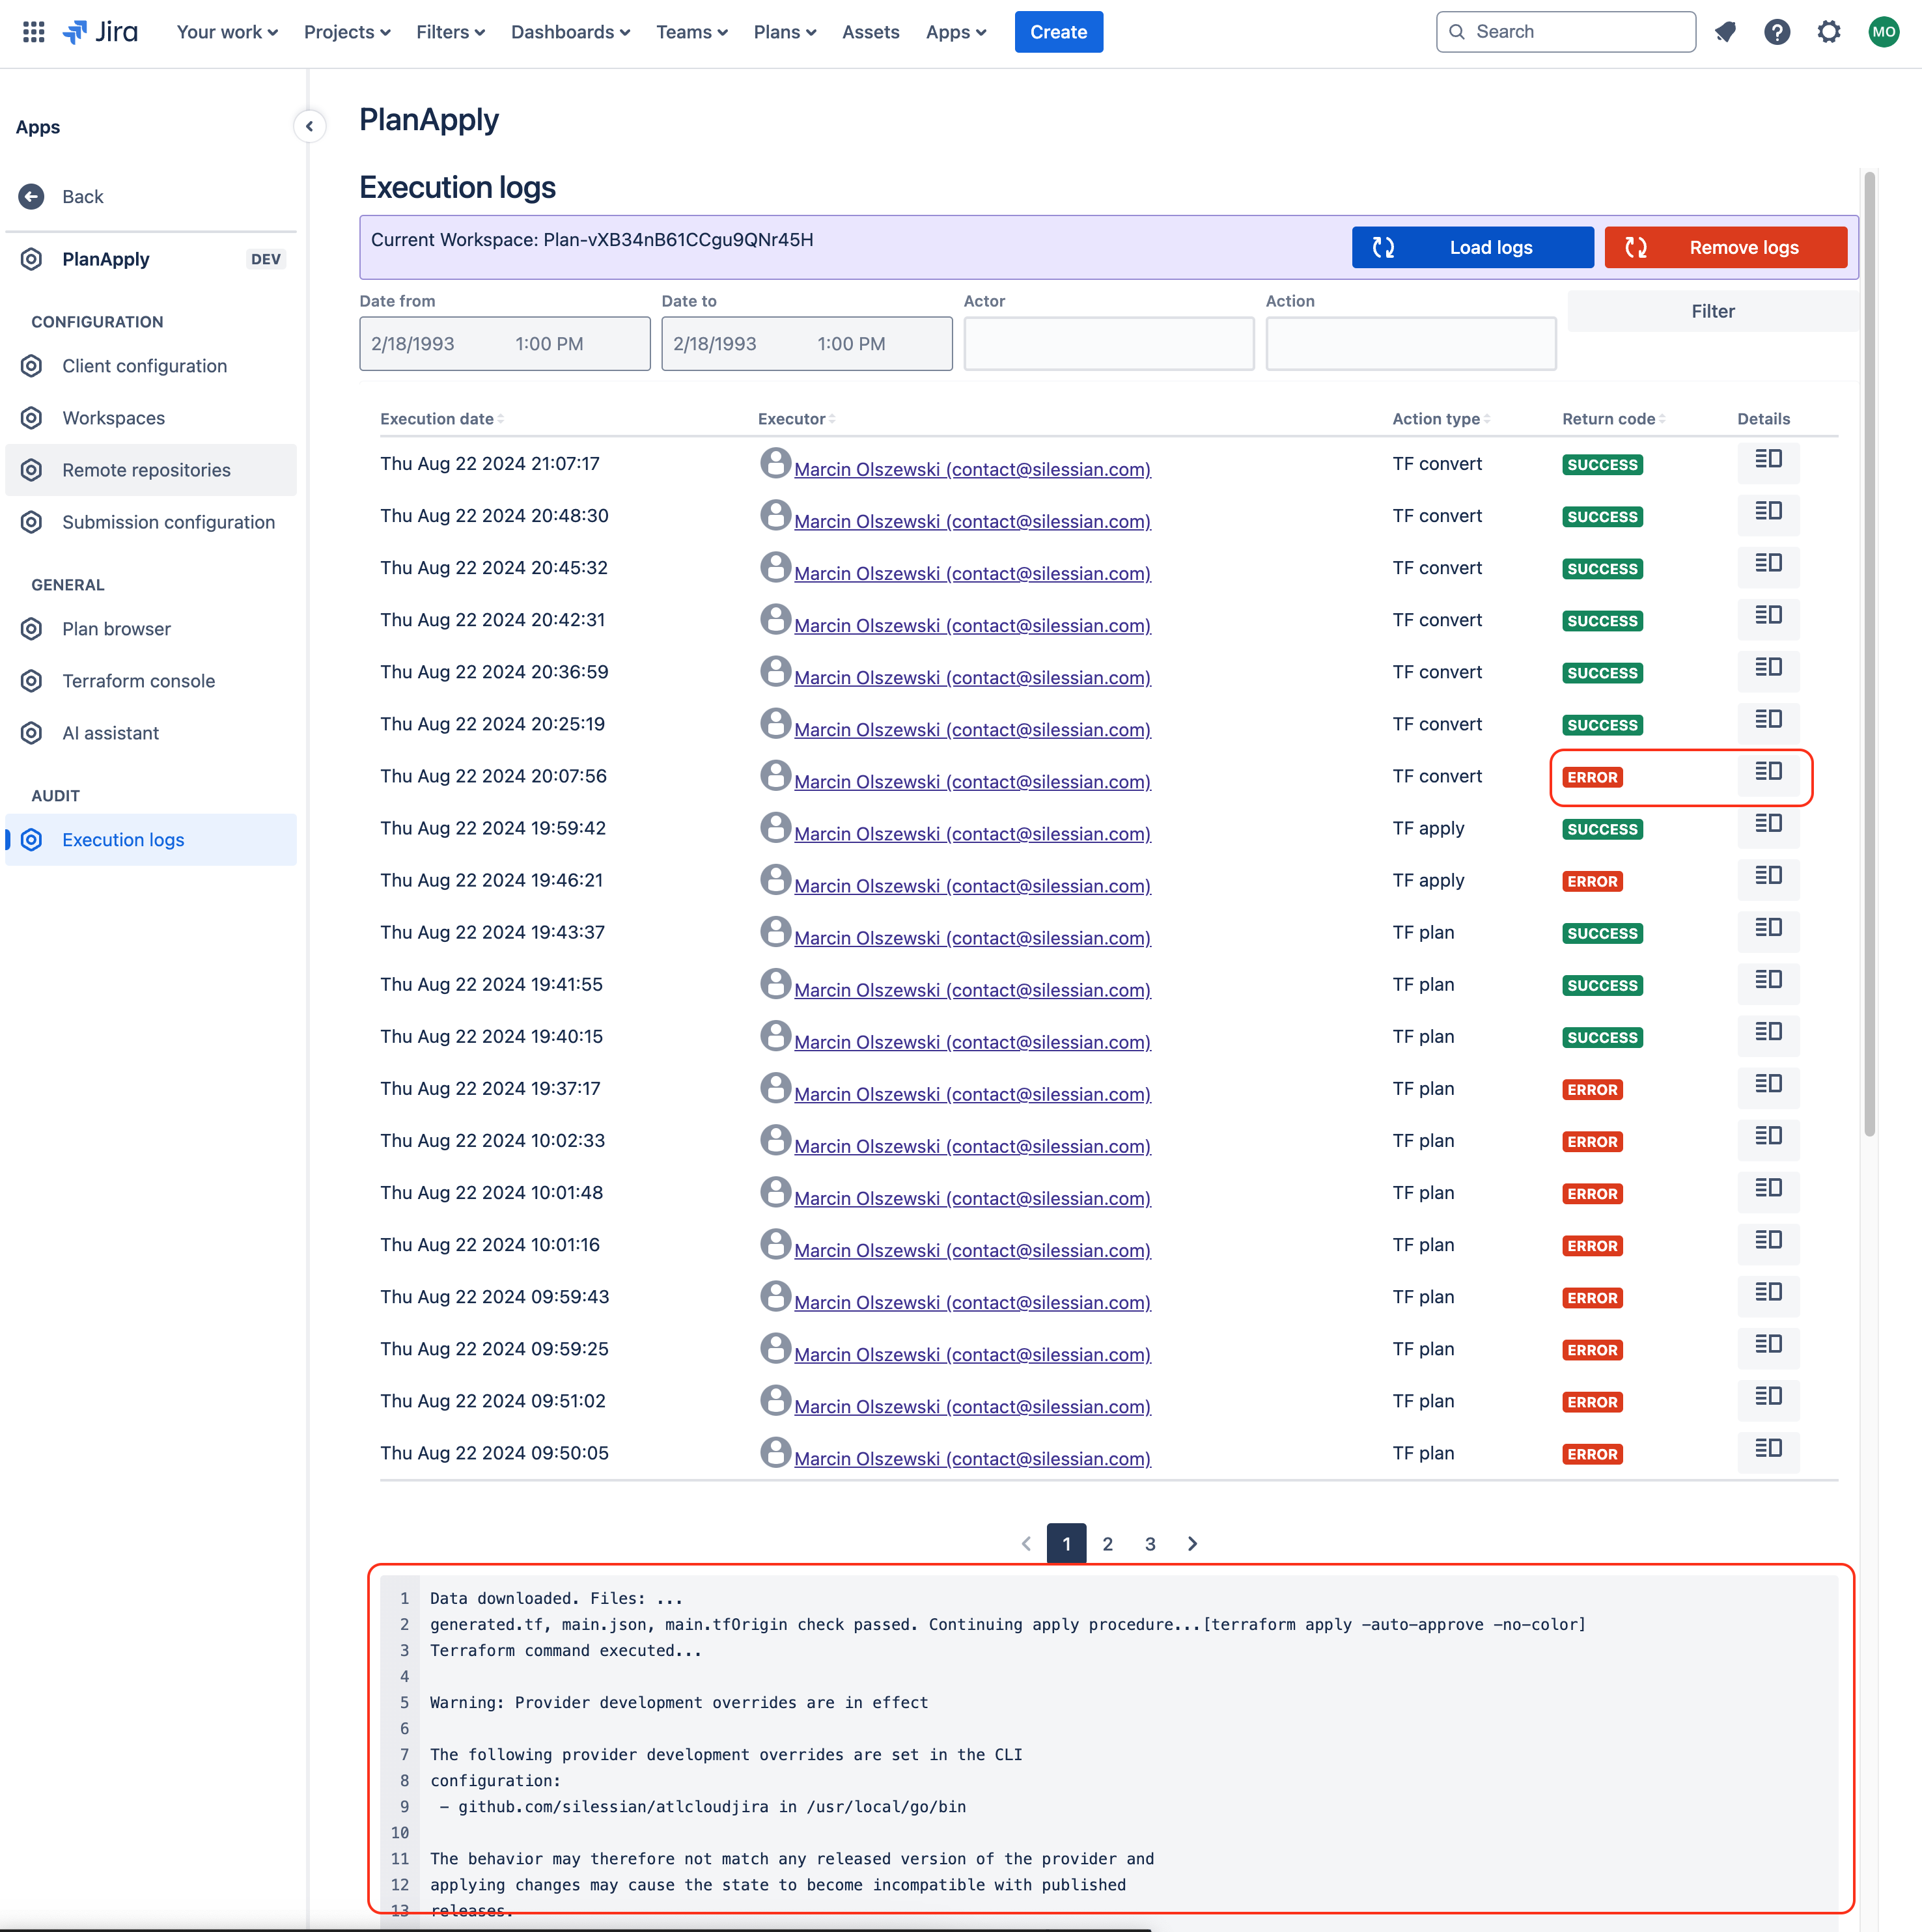
Example output of execution logs.
Clicking on details with display execution logs in code block below